CBRN Masks · Preparedness tools

Chemical Spill Simulator

See how a gas cloud from an industrial accident would drift and widen with the wind and weather – and whether and when it would reach you.

Explore. Understand. Prepare.Free tools for your own location.

Loading the simulator…

One moment, the map is being prepared.

Educational model, not a forecast. In an emergency, follow official alerts.How it works ↓

How to use it

  1. 1
    Place the releaseSearch a town or postcode, click the map or use your location. With your location on, the release is placed 5 km upwind of you.
  2. 2
    Set wind and weatherUse today’s weather or set it yourself: wind speed and direction move the cloud; sunshine, overcast sky or a clear night change how quickly it spreads sideways.
  3. 3
    Follow the cloudPress play. The bands show where most of the material is; the box shows whether and when the front would reach you.

A gas cloud does not stay where it was released.

The wind carries a cloud away from the source while turbulence spreads it sideways. On a sunny day it mixes quickly and widens; on a clear night with light wind it stays narrow and concentrated over long distances.

The bands show the generic shape of a cloud for constant wind. They are not concentrations of a specific substance, toxicity levels or evacuation zones.

How fast and how wide a gas cloud spreads

Arrival time and width of the cloud (about 95% of the material) at distance from the source, for a constant 10 km/h (6 mph) wind, calculated with the simulator’s model.

Distance downwindArrival at 10 km/hWidth on a sunny dayWidth with overcast skyWidth on a clear night
1.0 km · 0.6 mi6 min0.7 km · 0.5 mi0.3 km · 0.2 mi0.2 km · 0.1 mi
5.0 km · 3.1 mi30 min3.1 km · 1.9 mi1.3 km · 0.8 mi0.7 km · 0.4 mi
10 km · 6.2 mi60 min5.4 km · 3.3 mi2.3 km · 1.4 mi1.1 km · 0.7 mi
20 km · 12 mi2 h8.8 km · 5.5 mi3.7 km · 2.3 mi1.8 km · 1.1 mi

Stability classes: sunny day A–B (strong mixing), overcast D, clear night F (weak mixing). The width says nothing about concentration or toxicity, which depend on the substance and the amount released.

Prepare before you need it

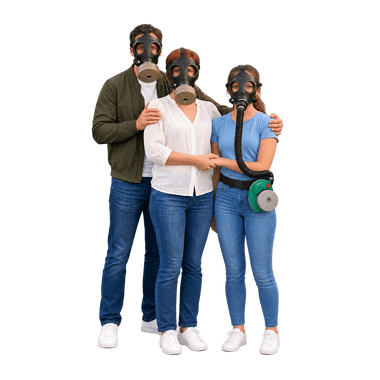
Protection for your whole family

Questions and answers

What does the chemical spill simulator show?

How a continuous gas release would drift with the wind and widen over time, using a standard Gaussian spread model with stability classes for sunny, overcast and night conditions.

How far can a toxic gas cloud travel?

As far as the wind carries it before it is diluted below harmful levels, which depends on the substance and the amount. At 10 km/h (6 mph) a cloud covers 10 km in an hour. On a clear night with light wind it stays narrow and concentrated: 10 km from the source it is only about 1.1 km wide, against about 5.4 km on a sunny day. That is why authorities often order sheltering in place for several kilometers downwind.

Does it calculate concentrations of real chemicals?

No. It shows the shape and timing of a generic cloud. Concentrations depend on the substance, the amount released and local conditions, which the model does not know.

What should I do if a chemical cloud is reported?

Go indoors, close windows and doors, switch off ventilation and follow official alerts. Leave the area only if told to, crosswind rather than downwind.

Which filter protects against industrial gases?

It depends on the substance. Combined filters capture several gas groups and particles at once. For substances outside their range, or when oxygen is lacking, a filter mask is not enough.

How the model works · assumptions & sources

Continuous release starting at the selected point and moving at constant wind speed. Leading edge = wind × elapsed time; after the release stops, the trailing edge follows at the same speed. Crosswind spread σy from Briggs (1973) open-country curves, σy = a·x·(1 + 0.0001x)^−1/2 with a = 0.22, 0.16, 0.11, 0.08, 0.06, 0.04 for stability classes A–F; Pasquill class from wind speed and sky (sunny day: A–C; overcast: D; clear night: D–F). Outer band ±2σy (about 95% of the material crosswind), core ±1σy. Arrival time at your location = downwind distance ÷ wind speed if you are within ±2σy. No source strength, substance properties, terrain, buildings, deposition or health thresholds are modeled; this is not ALOHA. Optional current weather: wind, cloud cover and sun height for the hour at the release point from MET Norway Locationforecast 2.0 (CC BY 4.0); a clear sky with the sun above 15° counts as a sunny day, a clear sky after sunset as a clear night, everything else as overcast.

Maps: VersaTiles, © OpenStreetMap contributors. Places and postcodes: GeoNames (CC BY 4.0). Reactor data: GeoNuclearData (ODbL 1.0, from IAEA PRIS) and the IAEA research reactor database as compiled by Wikipedia (CC BY-SA 4.0), status updated to October 2026. Current weather on request: MET Norway (CC BY 4.0). Without location permission, the starting area is estimated from the country the store detects and your browser’s time zone. City search runs in your browser; your exact location is used only with your permission and stays in this browser tab. “Use current local weather” sends the coordinates of the scenario point to MET Norway. Map tile requests reveal the viewed map area to the map provider.